.png?width=1366&name=Blog%20featured%20images%20(OT%20rule%20+%20retail%20KPIs).png)
How to Measure Retail Store Performance with Retail KPIs
In the retail industry, measuring store performance is crucial for sustained success. Retail performance management involves setting clear objectives, defining key performance indicators (KPIs), monitoring progress, and implementing strategies to boost business performance. By setting and continually monitoring retail KPIs, you can ensure your store stays on track and adapts to changing market conditions.
In this post, we’ll explore how to measure your store performance with retail-specific KPIs, sharing several examples of common metrics and how to track them effectively. Let’s dive in!
What is a retail KPI?
A retail key performance indicator (KPI) is a measurable value that shows how effectively a retail store is achieving key business objectives. It should be a specific, quantifiable metric that you can track over time.
Retail KPIs provide insight into various aspects of store performance — helping managers and leaders see what’s working and what’s not so they can make informed, data-driven decisions.
Why is it important to set retail KPIs?
Setting retail KPIs is essential for several reasons:
- Focus on business goals: KPIs help align your team’s efforts with your organization’s or store’s overall strategic goals set by leadership. They help you concentrate your time on the metrics that matter, and deprioritize the ones that aren’t a current focus.
- Performance measurement: retail KPIs help you track progress on an ongoing basis and identify areas needing improvement — as well as areas that are going well, so you can pinpoint successful activities to continue doing.
- Informed decision-making: KPIs provide data-driven insights, helping you make better business decisions (and removing human bias and error in the process).
- Competitive edge: monitoring KPIs can help you stay competitive by identifying trends and adapting quickly.
Things to consider when setting KPIs
When setting KPIs, consider your store's unique goals, products, customers, environment, and team dynamics. Not all KPIs will be relevant to every store, so focus on those that align with your specific objectives. Here are some factors to consider:
- Store goals: What are your short-term and long-term objectives? What areas are you most focused on improving now?
- Environment and positioning: What external factors (like location and market conditions, for example) affect your store? Who are your competitors, and how do you differentiate your business? Who are your customers and what do they expect?
- Team: How many people are on your staff across locations? How is your team’s performance and dynamic impacting store operations currently?
7 common retail store performance KPIs
Below, we’ll look at seven common retail KPIs that can help you measure and improve your store performance. Remember that this isn’t a comprehensive list, and the KPIs you choose to focus on will depend on your unique store and goals!
1. Year-Over-Year Sales
Understanding your store's growth over time is a basic and vital metric. Year-Over-Year Sales compares sales figures from the same period of time in the previous year to the current year.
What it is: The percentage change in sales compared to the same period last year.
Why it's important: Indicates growth trends and helps assess the impact of new strategies and activities.
How to track: Compare sales data from the current year to the previous year. Make sure you look at the same period of time in both years to get the most relevant, accurate insights.
2. Monthly Gross Profit Per Store
Monitoring your store's profitability on a monthly basis provides insights into financial health. Monthly Gross Profit Per Store measures the profitability of your operations.
What it is: Total sales revenue minus the cost of goods sold, calculated monthly.
Why it's important: Measures profitability and helps identify cost-saving opportunities.
How to track: To calculate your monthly gross profit, subtract the cost of goods sold in a given period from your revenue during that same time. Use accounting software to calculate your monthly gross profit.
3. Average Transaction Value (ATV)
Average Transaction Value (ATV) helps you understand the spending behavior of your customers, which can inform pricing and sales strategies.
What it is: The average amount spent by customers per transaction.
Why it's important: Indicates the effectiveness of sales strategies and upselling techniques.
How to track: Divide total sales from transactions by the number of transactions.
4. Sales Per Employee
Evaluating employee productivity is essential for operational efficiency. Sales Per Employee assesses the contribution of each staff member to overall sales.
What it is: The amount of sales generated by each employee.
Why it's important: Helps evaluate employee productivity and efficiency.
How to track: Divide your total sales by your number of employees to get an average across your entire team. Then, dive deeper by looking at individual sales data (sales per individual employee) to identify your top performers and the employees who might need more coaching.
5. Store Traffic (Foot Traffic and Online Visits)
Understanding Store Traffic — how many customers visit your physical store(s) and website — helps gauge your business’ overall marketing effectiveness and customer interest.
What it is: The number of customers visiting your store and website.
Why it's important: Indicates customer interest and marketing effectiveness.
How to track: Use foot traffic counters for physical stores and web analytics tools (such as Google Analytics) for online visits.
6. Customer Satisfaction Score
Your Customer Satisfaction Score, often called CSAT, reflects the quality of service and overall shopping experience, which is crucial for customer retention.
What it is: A measure of how satisfied customers are with their shopping experience.
Why it's important: Reflects the quality of service and customer experience.
How to track: Conduct surveys and collect feedback from customers via email, online post-purchase surveys, or other methods.
There are multiple ways you can measure customer satisfaction, but one of the easiest and most popular is the CSAT, where respondents answer the question “How would you rate your overall satisfaction with the [goods/service] you received?” from a scale of 1-5, with 5 being the most satisfied.
7. Customer Retention Rate
Your Customer Retention Rate measures the percentage of your existing customers who return to make more purchases. Having a high customer retention rate is a great indicator that people are satisfied with your products, that your brand and experience is resonating with them, and that you’re building a loyal customer base.
While it’s easier to accurately track the number of new customers in online stores using analytics tools and other software, it can be tricky for in-person stores. However, with tools and programs like unique customer loyalty/reward accounts and surveys, you can usually make a good enough estimate to give you an indicator of whether the number is trending up or down.
What it is: The percentage of customers who make more than one purchase from your store in a given time period.
Why it's important: Measures customer loyalty and satisfaction.
How to track: Use the formula CRR = (E-N) / B to measure customer retention rate.
CRR = Customer Retention Rate
E = the number of customers at the end of the time period
N = the number of new customers during the current period
B = the number of customers at the start of the time period
Track your retail KPIs with Shiftlab
By focusing on the right retail store performance metrics, you can gain valuable insights into your store’s performance, make data-driven decisions, and ultimately drive your retail business to new heights. Understanding what are key performance indicators in retail and how to measure retail performance are essential steps in measuring retail performance and productivity effectively.
Shiftlab’s employee scheduling platform can help you accurately forecast, strategically schedule your team, stay compliant, and track and report on your retail key performance indicators — all in one platform.
Here’s a look at some of the reporting in Shiftlab available to leaders to track KPIs:
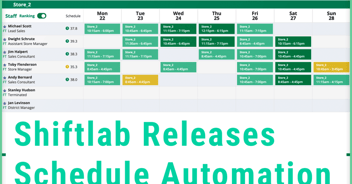
Schedule Performance Report: This report allows leaders to quickly see their scheduling and performance alignment both from a “what was planned” and “what actually happened” related to their territory. These metrics include:
- Sales
- Per Hour Productivity
- Hours Per Employee
- Overtime Hours
- Break Utilization
- Scheduled Employees (Physical)
- Full-Time Equivalent Employees (Hours)
Trending Hours Visibility: Shiftlab brings sales and timeclock data into a single view for your leadership teams to ensure that the scheduling strategy is coming to life as planned. The Trending Hours Visibility report shows you the scheduled vs trending hours mid-week and allows you to drill down into the variances to see if the excess/shortage of hours are going to the top or bottom performers in a given store, district, or area. This report is intended to bring your leaders into action before the payroll week is up.
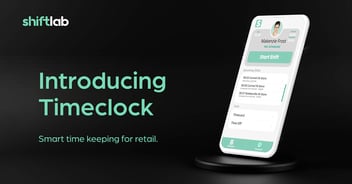
Store Pulse: Store Pulse is a real-time retail performance management dashboard. Whether it’s monitoring stores opening on time, overtime trends, shift compliance or more – we make it easy for retail managers to track key performance indicators and make faster, smarter decisions. Pulse provides real-time data for:
- Stores opening on time
- Trending Overtime
- Budget notifications
- Missed Breaks
Book a demo today to see how Shiftlab can enhance your retail performance management!